


The Windham Incident: Canary in a Coal Mine
The 2020 Windham, New Hampshire Election Scandal

The 2020 election in the small town of Windham, New Hampshire is a story of a local election anomaly that may be merely the tip of an iceberg--suggestive of more widespread anomalies. This is a data analysis of the Windham election results and the implications for the State of New Hampshire and the nation as a whole. The recount result for the local State Representative race in this small town is like a “canary in a coal mine,” warning of a clear and present danger to our democratic elections.
The voting machine used in Windham, and 85% of New Hampshire voting locations, is the Diebold AccuVote OC, which was first made in 1990 and has many serious known security vulnerabilities. The intellectual property for the machine is now owned by Dominion Voting Systems, the company that has recently been in the spotlight of election fraud allegations.
The recount of the State Representative race resulted in no change in the winners. But upon further analysis, it looks like there are at least a couple of candidates who could have been robbed of a victory at the state level. If an investigation of the Windham election uncovers evidence of voting machine manipulation, and similar evidence is uncovered across the state, then the most significant victim may turn out to be President Donald J. Trump. In that sense, President Trump is also a canary, whose defeat in New Hampshire signals danger to us all.
Ironically, the anomalies only came to light after Democrat Kristi St. Laurent requested a recount of the Windham race for State Representative. In this contest, between four Republicans and four Democrats for four seats that the Republicans had won easily in previous years, she was only 24 votes behind the fourth-place Republican. What makes this so ironic is that Ms. St. Laurent was the only candidate to lose votes in the recount while all four Republican candidates gained back a large number of votes that had not been counted by the voting machines. This is the largest unexplained election discrepancy in New Hampshire history and still has not been investigated by the Republican Attorney General, Secretary of State, or Governor! For more background on the events in Windham, start on this GraniteGrok.com election scandal page.
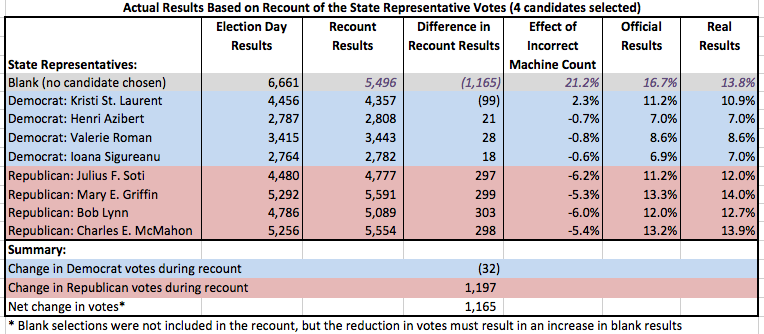
Let’s start with the facts. As shown in the table below, each of the four Republican candidates regained about 300 votes (about 6%) during the hand recount, which was held in public view and in front of video cameras for maximum transparency. Three of the Democrats regained a much smaller number of votes, while Kristi St. Laurent lost 99 votes. The Republicans still won all four seats, but unnerving questions remained. Why did the voting machines deliver such a discrepancy and where did the votes go? Possibly even more important is the question: why did the results from voting Machine #2 differ so much from Machines 1, 3, and 4?
The original voting machine election results and hand recount results of the State Representative election are shown in the table below. There was no recount for any of the other races even though the results for Machine #2 may very well be suspect for every other race.
For reference, the table below compares previous results of the State Representative elections in Windham, and shows how abnormal it is to even have a Democrat come close to winning a seat. The 2020 election shows a very large jump in the number of Democrat votes that may indicate that the election anomaly goes far beyond just the vote difference discovered during the hand recount.

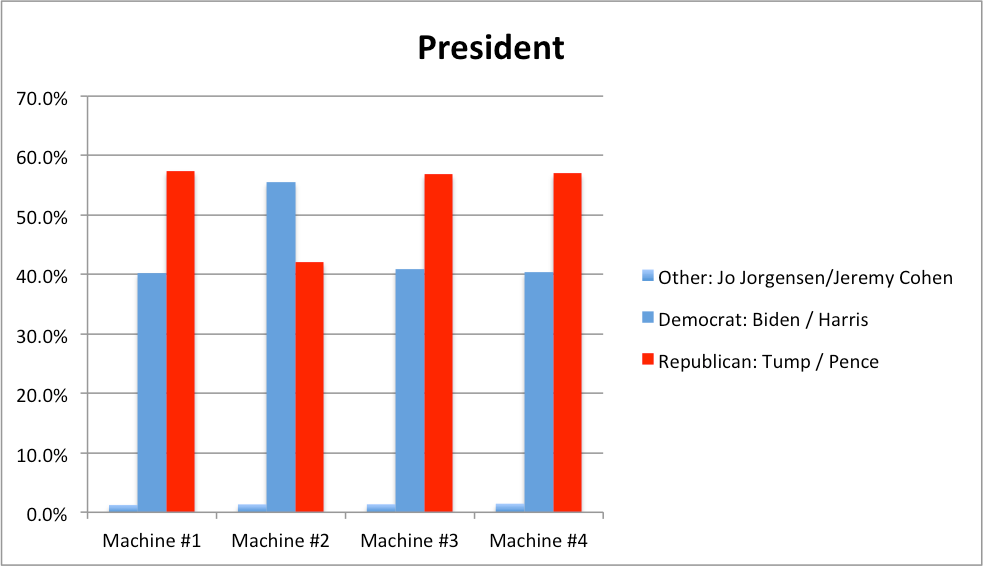
Since Windham is a small town, they only had four voting machines and we are fortunate to have the voting machine paper tapes showing the allocation of votes by each machine. The anomaly just about jumps out and smacks you in the face. Machines 1, 3, and 4 all had similar results, but Machine #2 has a significantly higher rate of votes for Democrats and lower rate of votes for Republicans. Machine #2 tabulated 33% of the ballots, so it should have yielded something close to 33% of both Democrat and Republican votes assuming that voters were randomly distributed among the four machines. That is not what happened. Machine #2 yielded about 40% of all Democrat votes and only 26% of Republican votes. Machines 1, 3, and 4 tabulated 67% of the ballots, but only delivered 60% of Democrat votes and 74% of Republican votes. Had Machine #2 delivered the expected proportion of votes, the numbers would have been similar across all four machines. The results for Machine #2 show an extremely large deviation from what would be statistically normal.

The distribution of votes per candidate is very similar for each machine except for an overall change in the relative level of Democrat vs. Republican votes on Machine #2, as shown in the chart below.

If we average the results from Machines 1, 3, and 4, you can clearly see the difference when compared to Machine #2 in the table below.

Before trying to explain the anomalies, we should expand our view of what happened with the other candidate races. Although there was no recount of the other races, every other one saw a similar issue with Machine #2 delivering a lower proportion of Republican votes and a higher proportion of Democrat votes. The other races had only two main candidates for each office, so it looks more like simple vote flipping, as shown in the charts below.


To explain these anomalies, here is a summary of what I think could have happened during the Windham vote. In the absence of hard evidence, they are just hypotheses that appear to explain the anomalous data. I’ll get into more detail below.
1. 10-15% of the votes for most races (President, Governor, Senator, etc.) were flipped from Republican to Democrat on Machine #2.
2. About 16% of the votes cast by Trump voters for a State Representative candidate were flipped to “Blank” undervotes on Machine #2.
3. About 4% of the votes cast by Trump voters for a State Representative candidate were flipped to Kristi St. Laurent on Machine #2.
4. Some percentage of the “Blank” undervotes for State Representative were flipped to Democrat candidates by someone manually filling in blank ovals on the paper mail-in ballots.
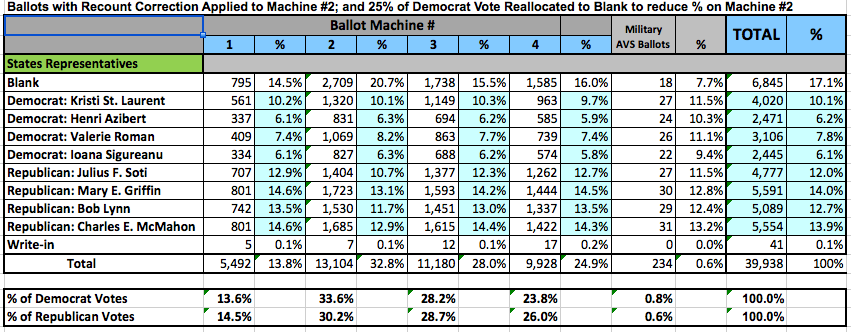
My first hypothesis regarding the State Representative race was that all the recount vote discrepancies were the result of something going wrong on Machine #2, which was somehow losing about 300 votes per Republican candidate, losing a small number of votes from three Democrat candidates, while at the same time giving votes to Kristi St. Laurent. So, I recalculated the vote percentages after applying all the hand recount corrections to Machine #2. The result, as shown below, was an increase in the Republican vote percentage (from 26% to 30%) that brought them closer to those on Machines 1, 3, and 4. But the percentage of Democrat votes on Machine #2 didn’t change much. So, something still seemed wrong with Machine #2.


The State Representative election anomalies, with 8 candidates running for 4 positions, had to be more complicated than a simple vote flip between two candidates because the Democrats did not gain all the votes that the Republicans lost. Overall, we now know that the machines lost 1,197 Republican votes and added 32 Democrat votes, leaving a net loss of 1,165 votes. But the Democrat results are complicated because the machines added 99 votes for Kristi St. Laurent while taking 67 from the other Democrats. My hypothesis about the role of the voting machines is as follows. To be clear, it is just a hypothesis that remains to be proven by a forensic analysis of the software.
Machine #2 may have evaluated ballots based on whether or not there was a vote for President Trump and then taken approximately 16% of each State Representative vote and moved it to the “Blank” category. “Blank” votes refer to undervotes--when a voter does not cast a vote--and is common with down ballot races if voters are not familiar with the candidates. My assumption is that 57% of Windham voters actually voted for Trump, which is based on the results from Machines #1, 3, and 4. Since most Trump voters are likely to have voted Republican down ballot, this machine vote removal would mostly affect the Republican candidates for State Representative. However, it is likely that a small percentage of Trump voters voted Democrat down ballot, which could explain the anomaly that some Democrat candidates also lost a small number of votes.
But why would Kristi St. Laurent be the only candidate to gain votes? Perhaps there was a second process running against Trump voters that took about 4% of the votes for each other candidate (Republican and Democrat) and applied them to her tally. This could explain her 99-vote gain. The numbers used here are not going to be precise because we don’t know the exact algorithm or number of Trump voters using Machine #2 or the way that each voter voted down ballot, but the numbers provide a possible explanation. I find it doubtful that Ms. St. Laurent would have had any knowledge of this scheme or she would have been unlikely to ask for a recount that could expose everything and put her squarely under suspicion. Perhaps someone wanted just one Democrat to win so as not to arouse too much suspicion.
Unfortunately, reallocating the recount results to Machine #2 did not correct the unusually high percentage of Democrat votes on that device (40% of Democrat votes for a machine with 33% of ballots cast). There are two possible explanations for this anomaly. First, twice as many Democrats might have used Machine #2 compared to the other three machines. But that seems unlikely unless somebody was specifically directing Democrats to Machine #2, which would in itself raise suspicions. The second explanation is that some other process was responsible for the addition of extra Democrat votes cast on that machine.
Although the recount did not keep a record of blank votes, my hypothesis is that the net increase of 1,165 hand-counted votes should have resulted in a corresponding reduction in the number of Blank votes on Machine #2. But the reduction in the number of Blank votes made that number too much lower than that of the other machines to seem plausible. There should have been more Blank votes when compared with the other machines.
To explain the anomaly of too many Democrat votes and too few Blank ballots, my next hypothesis was that someone had manually filled in about half of the Blank votes on mail-in ballots cast on Machine #2 in order to create additional Democrat votes. Is it likely that paper ballots could have been manually modified? Sworn affidavits have been presented to the Attorney General regarding complaints from Republican poll watchers who were prohibited from meaningfully observing any part of the election process. This included the processing of absentee mail-in ballots as well as the handling and processing of ballots deposited into a drop box outside of the polling place on Election Day.
My assumption is that these extra votes were apportioned equally to each Democrat, but they could have been random. To see what would happen, I reduced each Democrat vote total on Machine #2 by 25% (337 votes) and made a corresponding increase in the number of blank votes, as shown on the next chart. This brings the percentage of Democrat and Republican votes much closer to the 33% of ballots cast on Machine #2. All of this is, of course, hypothetical in the absence of evidence. Even if true, it could be very difficult to tell if any of the marks on a ballot were added by someone other than the voter.
The reallocation of those votes back to the blank category would reduce the overall vote total for Democrats, as shown in the table above, but their 2020 votes are still well in excess of previous years, as shown in the table below.

As for the other candidate races, if vote flipping occurred on Machine #2, it may have resulted in major vote redistributions as shown in the hypothetical scenario below. My assumption is that Machine #2 should have had a vote count very close to that of the other voting machines.
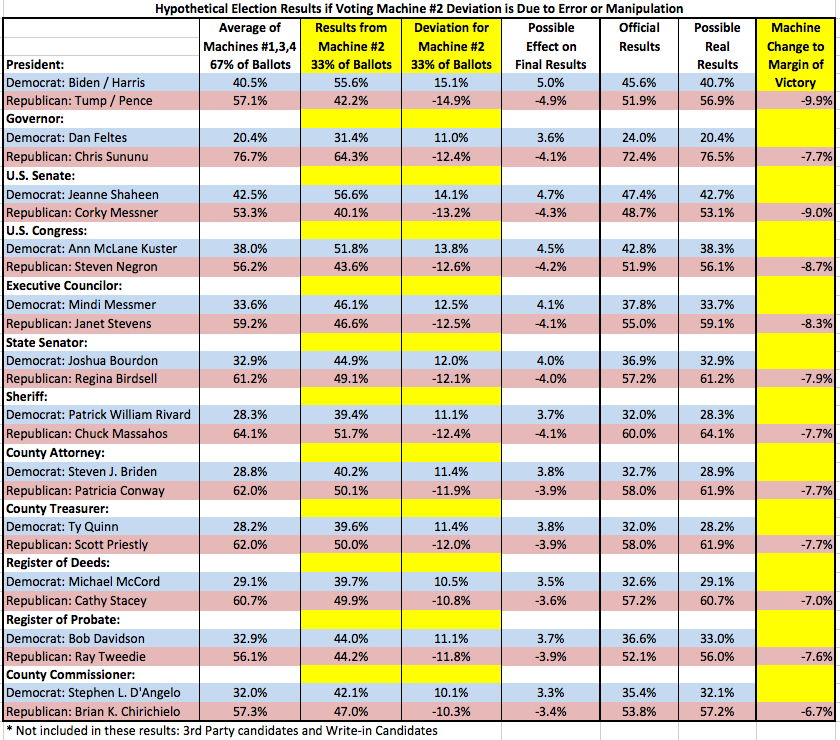
As is evident, the only change in the Windham results would be the margin of victory. If that is the case, what would be the purpose of such a scheme? Why would Windham experience vote redistribution that had no effect in local elections? Perhaps someone wanted at least one Democrat to win the State Representative race and thought it might not look too suspicious. If true, however, it may prove to be a mistake that revealed the entire scheme. Perhaps the shift in the margin of victory was merely cover for the real target at the state level. What happened in Windham was just collateral damage.
If vote flipping changed the margin of victory on AccuVote OS machines throughout the state, similar to what appears to have happened on Windham Machine #2, the table below shows some possible results on a statewide level. President Trump and Republican District 1 candidate for Congress Matt Mowers both might have actually won their races.

Of course, all these hypotheses could be completely wrong. We will not know until we take a good hard look, which seems to be what the Governor, Secretary of State, and Attorney General want to avoid. Although Governor Sununu may have also lost votes, his margin of victory was so large there was never any real doubt he would win. Only a forensic analysis of the voting machines and the ballots will put speculation to rest.
In my next article, I will look at the means, motive, and opportunity to effect such a change in the New Hampshire election results.
I have Amherst and the numbers are crazy with other “date”
Anomalies..how do I
Send them
To you
Awesome job. I have the machine tapes for Bedford and the anomalies are worse than Windham’s. Can I send them to you? The tapes do not reconcile with the posted town results and my town moderator hung up on me when I presented him with a list of questions.
Please help. I’m a writer for Granite Grok. The corruption is out of hand.