Unwrapping the 2020 New Hampshire Election Anomalies
A riddle wrapped in a mystery inside an enigma; but perhaps there is a key
This article was inspired by a four-part series called “The Little Red State with a Big Blue Crown,” which I highly recommend reading (links: Prologue, Chapter 1, Chapter 2, Chapter 3). I wanted to verify the data analyzed in those articles and dive even deeper because they show that the election results for the entire state of New Hampshire do not make sense. Also see: “What the Hell Happened in NH.”
Why does anyone even care about New Hampshire elections? The Democrat win of a NH Senate seat in 2020 helped them to gain control of the Senate. If the Democrats had won the 4 NH electoral votes in the 2000 presidential election, the “hanging chads” vote controversy in Florida would never have even mattered and Al Gore would have been elected President with 270 electoral votes. The 2000 election made NH a small but potentially critical swing state. Any Democrat election strategist would have been sure to take NH more seriously from then onward. They might have even been willing to cheat. And some Republicans may have even been dumb enough to go along with it out of greedy self-interest.
In my first article, I performed a data analysis of the Windham, NH 2020 election incident anomalies. In my second article, I compared it with the 2018 Winterville Train Depot, Georgia incident and then described the means, motive, and opportunity for fraud to have possibly occurred. With this article, I expanded my analysis to the entire state of New Hampshire.
It is starting to look like the Windham Incident recount of the State Representative race may actually have been caused by machine error rather than a fraudulent computer algorithm. The old AccuVote machines seem to get fooled when scanning an absentee ballot if the paper fold line goes through an unfilled vote oval. Experiments have shown that this can cause votes to be counted that aren’t really there or cause an overvote to occur, which results in the rejection of valid votes. However, even if this machine error was the cause of the mis-count, it doesn’t mean that other methods of voter fraud did not occur. How ironic would it be if malfunctioning machines revealed a different, but real, source of fraud?
Without a forensic analysis of the entire election, the electronic data available does not provide proof of fraud. However, the anomalous data provide what I consider to be indicators of fraud because they show results that are abnormal and intuitively wrong. In short, Democrats won at the federal level while Republicans won at the state and local level. While not impossible, it invites further investigation.
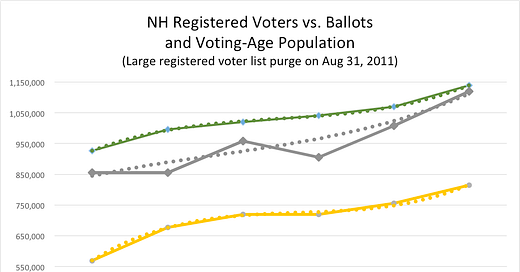
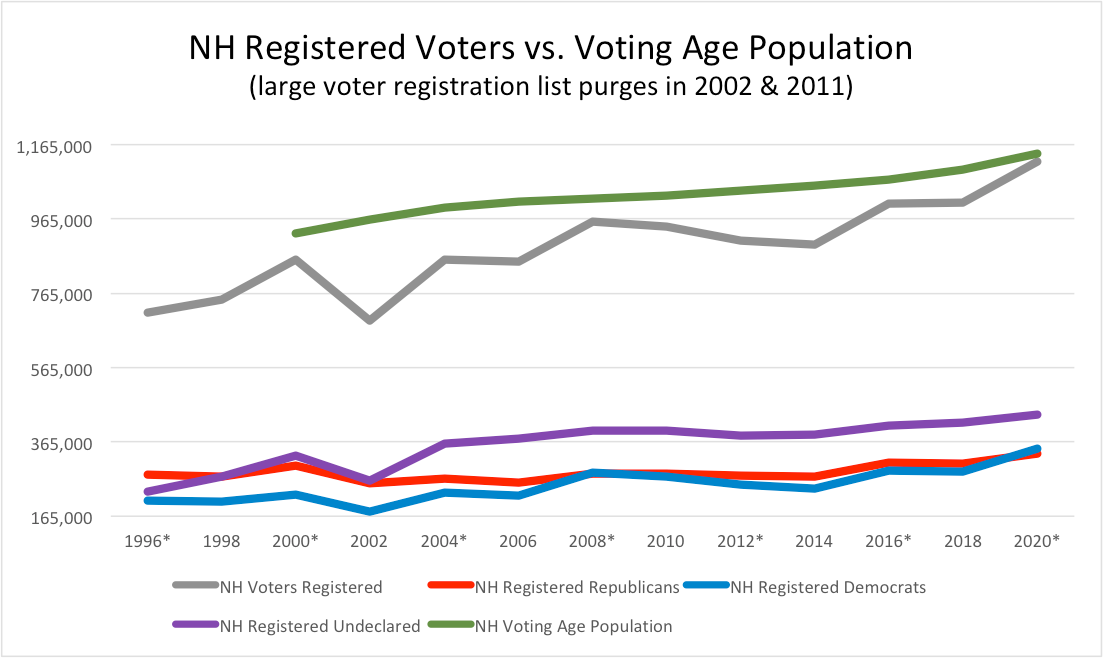
Let’s start with the voter registration database, because if fraudulent votes were cast, they would start with fraudulent registrations. The chart below compares the number of registered voters over time with the number of voting-age NH citizens. In 2000, the number of registered voters was about 93% of voting-age citizens. There was a large purge of invalid voters in the registered voter list in 2002, which reduced the number down to 86% of voting-age citizens, but it grew back to 94% after a record-breaking surge in Democrat registrations prior to the 2008 Obama election. There was another purge in 2011, down to 87%, but it grew back again to 94% by the 2016 Trump election. By the 2020 Biden election, the number had jumped to a historically high 98%, mostly due to a 20% surge of registered Democrats. Each time there has been a purge of invalid registered voters, it has mostly affected Democrats. Before you consider the possibility that Democrats may have been unfairly targeted, I should point out that all of these purges took place under the leadership of Democrat NH Secretary of State (SOS) Bill Gardner, and Democrat governors.
The narrative for the 2020 surge might be that Democrats really wanted to get rid of President Trump, so they registered and came out to vote in record numbers. But there are problems with this narrative. First of all, most new registrations in NH seem to come from election-day registrations, which were actually lower in 2020 than the previous three presidential elections. There are normally so many election-day registrations that it accounts for most of the increase for each presidential election year. There are also more election-day registrations than the increase in ballots. This means that either many previously-registered voters decided not to vote, or some votes are not getting counted.
Who are all these people registering to vote on Election Day? NH uses such a liberal definition of “domicile” for voting purposes (contrary to the letter and intent of the state constitution), that people can come into the state on the day of the election, vote, and leave the next day. They can register and vote without any identification or proof of domicile by signing an affidavit. A 2017 Patch article described how thousands of people have been allowed to vote without any proof of domicile but have never been investigated due to a manpower and funding shortage in the Attorney General’s office. Even Secretary of State Bill Gardner has admitted this is a problem that permits fraudulent voting to occur. Project Veritas exposed a person who was eventually charged with felony voter fraud in the 2016 but was fined only $300 by the NH Attorney General. In other words, he cast a fraudulent vote for the low, low price of $300, and is now a certified poll watcher for the Democrat Party.
This 2021 Granite Grok article documented how someone voted via absentee ballot in Nashua in 2020 using the real name of individuals who are no longer residents at the address claimed. Allowing election-day registrations or absentee ballots to be counted without any likelihood of investigation, and a minimal fine if caught, only encourages fraud. If voters were only allowed to submit a provisional ballot that would only be counted in the event of a tight race, and only after their domicile and identity had been verified, there would be less incentive to commit voting fraud and little chance that it would impact elections. But back to the data.
Why did the number of ballots cast in 2020 increase at lower rate than the registration rate, with only 58,649 new ballots compared to 75,611 election-day registrations and 111,830 total new registered voters? It is as if people were super excited to register to vote but not so excited about actually voting. Interestingly, there were 59,020 additional registered Democrats in 2020, which is slightly higher than the number of additional ballots. In fact, the number of ballots cast per registered voter has been in decline for the past two presidential elections and would have declined in the 2008 and 2012 elections if not for the previous purges of invalid registered voters. The overall trend shows increases in the number of registered voters moving towards 100% without a corresponding increase in ballots cast.
Some analysts have discussed the existence of a large number of “phantom voters” in state registration databases. A phantom or shadow voter is a fictional person placed in the database for the purpose of casting fraudulent votes. One allegation is that votes cast by phantom/shadow voters are used to replace the votes of real voters, which helps to avoid a suspicious increase in the number of ballots. If this is the case, then the surprise victory of President Trump in 2016 may have prompted Democrats to inflate the number of registered voters higher than it has ever been (98% of eligible citizens) while only slightly increasing the number of ballots counted.
Only a forensic analysis of that database, combined with verification of the voters themselves, will reveal if all those registrations are legal or even real. In other states, we have seen that many phantom/shadow voters are registered using non-existent addresses (non-residential buildings, vacant lots, Post Office boxes, etc.), or even at the address of valid voters, so an analysis of the voter registration list is badly needed.
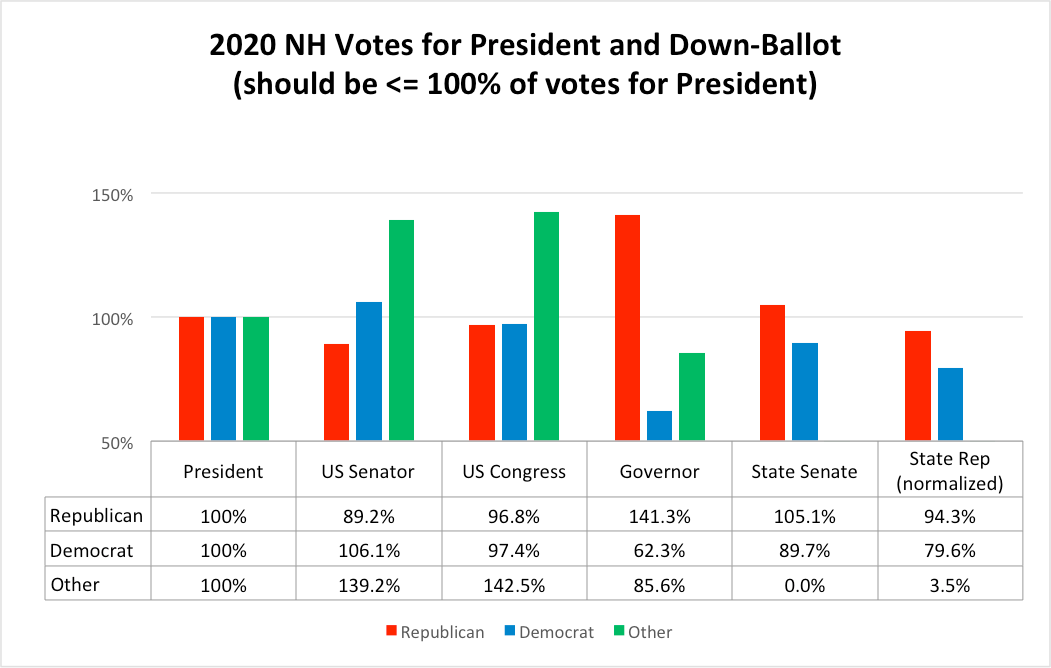
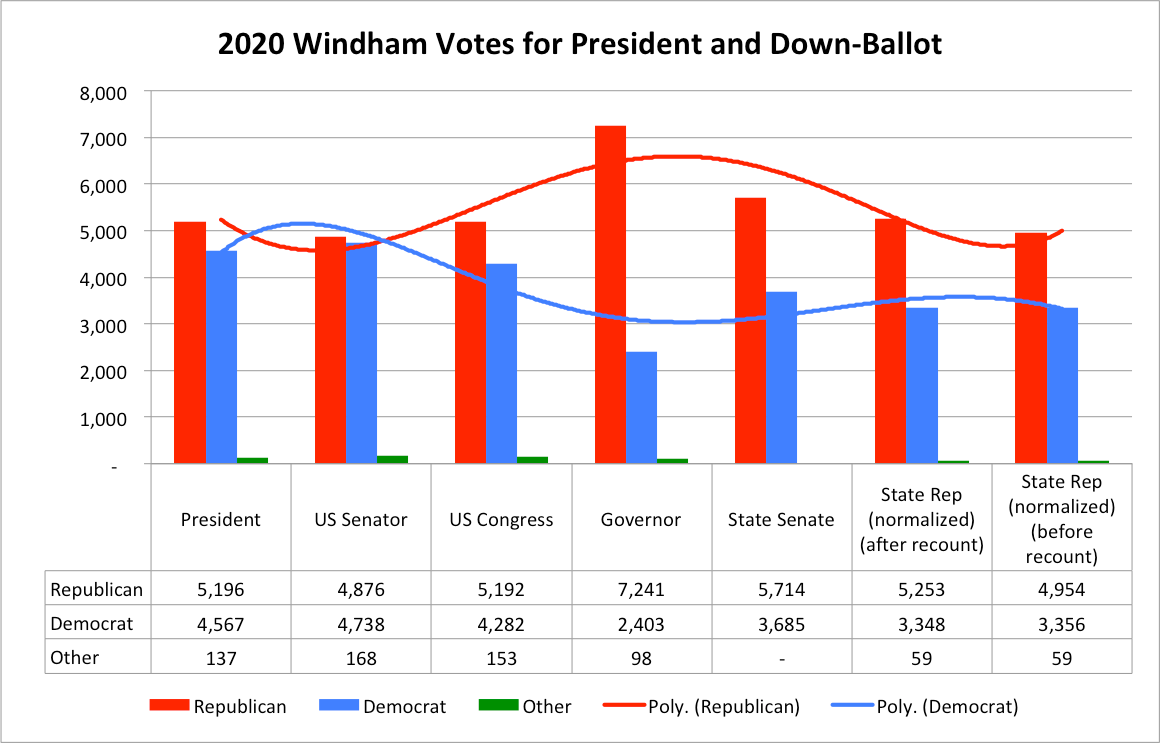
Let’s look at the phenomenon of NH voters apparently choosing Democrats to represent them in Washington but Republicans to represent them at the state and local level. The following chart shows a comparison of the voting preferences for several races. The overall 2020 vote total chart shows a normal view of how down-ballot voting works. Most people vote for the presidential race and other major races, but votes for down-ballot races tend to drop off. I should point out, however, that the Windham audit has shown that the actual number of votes for State Representative should be higher due to machine errors that changed valid votes to “blank” entries.
But when we look at the same chart broken down by party vote, we see a strange result. The average NH voter seems to prefer a Democrat for President, US Senate and Congress, but a Republican for Governor, State Senate and State Representative. While not impossible, this sure seems implausible. The narrative, which seems to be supported by polls, is that many Republican voters abandoned Trump to vote for Biden, but if that is the case, why did Democrat Senator Jeanne Shaheen get even more votes than Biden? For that to happen, Republicans who voted for Trump must also have voted for her.
However, even more odd, but barely noticed, is that more people voted for the Libertarian candidates for US Senate and Congress than for the Libertarian candidate for President. Why is this odd? Because people who vote for a third party candidate know they will not win and are most likely voting out of protest. If that is the case, they why didn’t more people protest against the polarizing presidential candidates (Trump or Biden) than the less-polarizing candidates for Senate or Congress? Why did the overall vote for all Libertarian candidates also decline from 2016 to 2020 if this election was even more polarizing? The following chart uses percentages with the presidential race acting as the baseline to show how party-line voting diverges from what is expected.
Is it possible that someone removed votes from both Trump and Libertarian presidential candidate Jorgensen, while inadvertently leaving too many votes for the Libertarian candidates for US Senate and Congress? Again, I’m just looking for plausible explanations, but it is impossible to know without a forensic analysis of the ballots and voting machines.
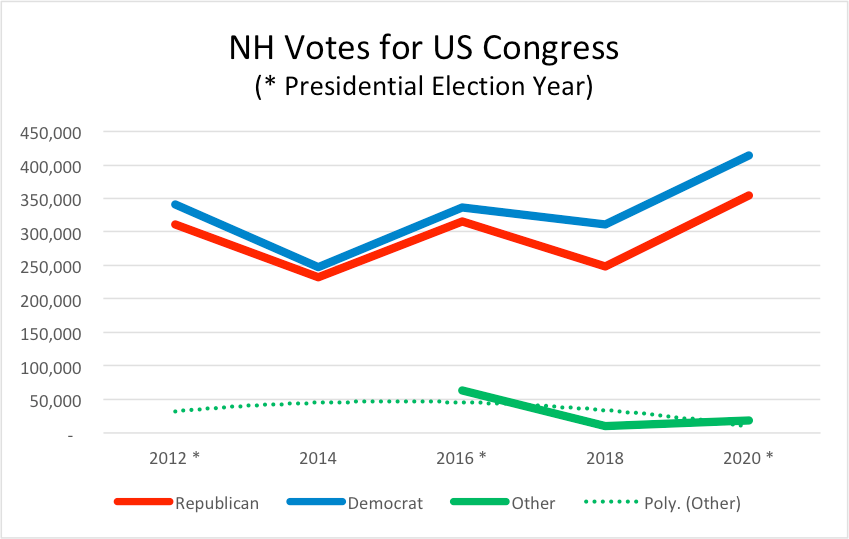
Next, let’s look at the votes for President. The number of votes for a Democrat, which peaked in the 2008 Obama election, went into a steady decline in 2012 (for Obama) and 2016 (for Clinton) until a sharp uptick in 2020 (for Biden). This sharp reversal looks very abnormal. The number of votes for the Libertarian candidate also declined in 2020 after increasing in 2012 and 2016.
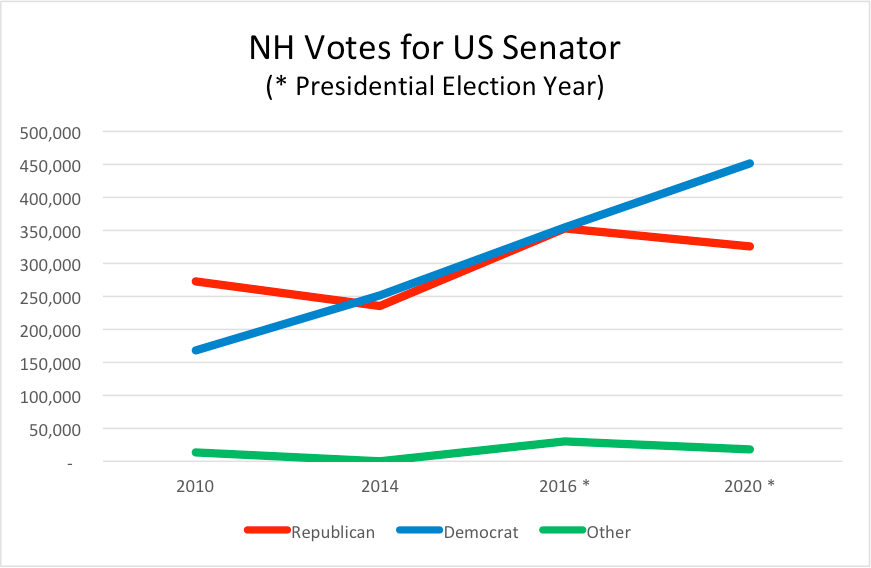
When we look at the votes for US Senate, we see an even more disturbing trend. The first two Senate races took place in non-presidential election years when voting activity is normally lower. You can see how the number of votes for the Republican candidate show a surge for the 2016 presidential election year, after having been lower in 2010 and 2014, as expected, but then show a sharp decline in 2020. Meanwhile, the votes for the Democrat candidate proceed on a steady upward slope every year, even in a mid-term election. This also looks very abnormal. The votes for US Congress, by comparison, show more normal changes, although the Republican and Libertarian candidates declined more than the Democrats in the 2018 mid-term election.
The Windham votes show a similar pattern as the overall NH results. Again, why did Trump voters abandon the Republican Senate candidate and vote for Democrat Shaheen? Why did so many Democrats vote for Governor Sununu? Why did 70 voters not cast a vote for President (10,006 total ballots were cast)?
While looking at the lower performance of Republicans in mid-term elections, I also noticed a strange trend in State Representative mid-term election years. The Democrats have managed to take control of the 400-seat legislature (House of Representatives) only in mid-term elections. The same Democrat over-performance seems to apply to the races for State Senate, US Senate, and US Congress during mid-term elections. Is it easier for Democrats to win those races in non-presidential years when there is lower voting participation?
At the same time the number of votes for Democrat candidates for US Senate and Congress have been steadily increasing, votes for Democratic candidates for Governor have been steadily decreasing. Votes for Republican candidates for Governor have been steadily increasing. In fact, 2020 saw a sharp increase in support for Governor Sununu as he crushed his opponent. Why is there so great of a disparity between the federal and gubernatorial races? Is Sununu really just that popular?
At this point I think it is reasonable to ask a few more questions. Why have the Windham incident election discrepancies been mostly ignored or sabotaged by both the Democrats and the Sununu administration? The governor himself has downplayed any possibility that there were election irregularities and his attorney general has continued to ignore calls for an investigation and appears to have tried to sabotage the integrity of the audit by selecting hostile auditors and preventing a forensic analysis of the ballots. Why would a Republican administration do this?
In Georgia, the Republican governor’s administration also opposed any challenges to the 2020 election. Perhaps this is related to the election fraud claims against Governor Kemp by his opponent, Democrat Stacey Abrams, in the 2018 gubernatorial race.
I can only come up with two possible explanations for what is happening in New Hampshire elections. 1. Governor Chris Sununu wants to distance himself from the election controversy in order to gain even more votes from Democrats (despite having already won by a huge margin), or 2. Governor Sununu is also somehow involved in the cover-up of election fraud.
In the latter case, why would Sununu be such a big winner considering the Democrats won the presidential, Senate, and Congressional elections? Is it possible Sununu and his attorney general became aware of fraudulent election activities and made a deal with the Democrats to ensure that he won big if he let them get away with it? There is no evidence of this, but it seems like a plausible explanation that might explain the disparity in election results and the attorney general’s hostility and fierce resistance to performing its constitutionally-required role as an investigator of possible fraud. After all, Sununu can best be described as a RINO (Republican in name only) who often sides with the Democrats on critical issues.
Is it possible that NH voters simply like to send Democrats to Washington? Sure, the polls seem to say they do, but election polls have been catastrophically bad and discredited (see this Atlantic article too) over the past two elections. The disparity in results strains credibility and New Hampshire election results utterly fail the smell test. When NH voters choose Republicans to run the state but send Democrats to Washington, election results seem more aligned with the popular local phrase “Go away and leave us alone.”
New Hampshire Population and Voting Data Sources:
US Census (2020):https://www.census.gov/data/tables/2020/dec/2020-apportionment-data.html
US Census (NH Data):https://www.census.gov/quickfacts/NH
NH Census Data (2020):https://www.nh.gov/osi/data-center/2020-census/index.htm
NH Census Data (1960-2010):https://www.nh.gov/osi/data-center/census/
NH Population Estimates by Year:
https://www.nh.gov/osi/data-center/population-estimates.htm
NOTE: To determine voting-age population, start with 2000, 2010, and 2019-2020 census data, fill in the intervening years with NH population estimates, and interpolate the census voting-age population percentages to calculate voting-age population for intervening years)
NH Additional Population Data:
https://newhampshire.hometownlocator.com/census/sorted-demographics.cfm
NH Election Results (2008-2020):https://sos.nh.gov/elections/elections/election-results/
NOTE: NH Election results are distributed among many different Excel, PDF, and HTML files and need to be aggregated for comparison. Includes votes, registration data ("names on checklist") and ballots cast (absentee vs. regular).
NH Registration History (2008-2020):https://sos.nh.gov/elections/voters/voting-in-new-hampshire/party-registration-names-on-checklist-history/
NH Registration History (1980-2006):https://sos.nh.gov/media/j4zkxopt/1980-2006-party-registration-names-on-checklist.pdf
NH Voter Turnout Charts:https://sos.nh.gov/elections/voters/voting-in-new-hampshire/presidential-election-voter-turnout-charts/
Articles with additional data:
NH 2000 Election Results:
https://en.wikipedia.org/wiki/2000_United_States_presidential_election_in_New_Hampshire
NH House of Representatives Control History:
https://en.wikipedia.org/wiki/New_Hampshire_House_of_Representatives
NH List of Governors:https://en.wikipedia.org/wiki/List_of_governors_of_New_Hampshire
NH Floterial Districts:
https://en.wikipedia.org/wiki/Floterial_district
NOTE: Floterial districts are a special case in the State Representative race. Voters in some areas get to vote for regular State Reps and extra State Reps if they are in a floterial district. Floterial data must be excluded to normalize State Rep data when comparing State Rep votes with that of other races. Votes in each precinct for regular State Rep races must also be divided by the number of allowable votes each voter may cast in order to normalize the voting rate data for comparison with other races.
Article on checklist purges:https://www.eagletribune.com/news/local_news/n-h-has-fewer-registered-voters-than-in-2008/article_8eea0c2d-0817-5a8f-b88e-01a0cf5991b3.html
Article on checklist purges:https://www.eagletribune.com/news/new_hampshire/election-statistics-show-growing-percentage-of-independent-voters-in-nh/article_ea710014-8c1e-544d-8f4b-f2ee37a16131.html
Article on registrations and possible fraud:https://www.wmur.com/article/new-voting-statistics-show-6540-people-registered-to-vote-in-nh-last-year-using-out-of-state-drivers-licenses-as-ids/12196129










Yes please list your sources! Thanks so much for this info!!
Can you list where you got your research?